Quantifying the lift in retail sales during festive season at Walmart, using R
Summary
The retail industry in the US makes most of its revenues in the 4th quarter - the festive occasions of Thanksgiving and Christmas cause massive jumps in transaction volumes at any major American retailer. This project quantifies the lift that a retailer (in our case, Walmart) experiences in sales during this time of year, when compared with other ‘normal’ times of the year. Through analysis, we’re able to identify which stores experience the sharpest spike, which can be useful to management when identifying which locations to allocate marketing dollars toward. Additionally, we can also identify stores where the jump is not as pronounced, and identify areas that need further investigation.
Data Source
The data is sourced from Kaggle, you can view it here - it contains information on the weekly sales at 45 Walmart locations for a period of around 143 weeks, from 2010 - 2012. This is a very interesting time in history, given that the US was just recovering from a major economic downturn. The dataset contains confirmation on a host of macro-economic indicators, such as the unemployment rate, price of gas at the pump, and consumer price index (CPI), in addition to information on whether the week contained a holiday, as well as the dollar amount of sales transacted.
Exploratory Data Analysis
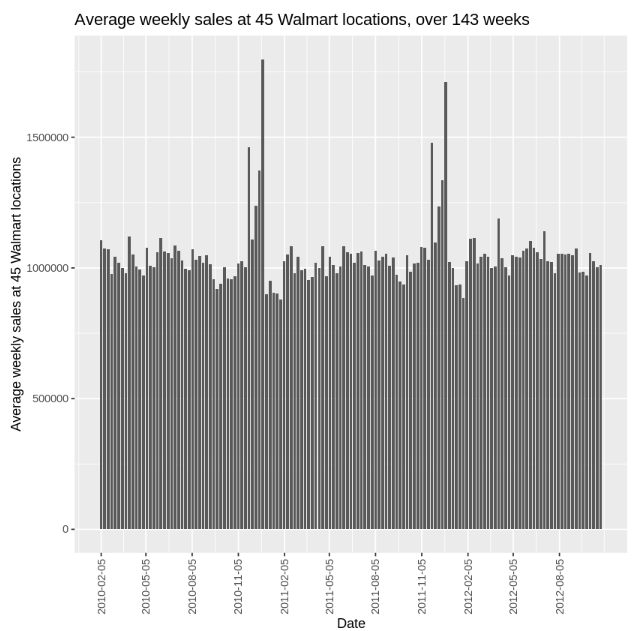
Using R’s ggplot package, I was able to graph the average weekly sales (across all 45 locations) for the 143 week period. Seasonality is immediately evident, and 2 spikes in close proximity to each other are seen every year. These spikes correspond to Thanksgiving and Christmas respectively. Walmart does a very, very consistent amount of business on a weekly basis outside these occasions (around $1MM / week). Thanksgiving and Christmas see well over a 50% surge compared to other times of the year - which I aim to quantify.
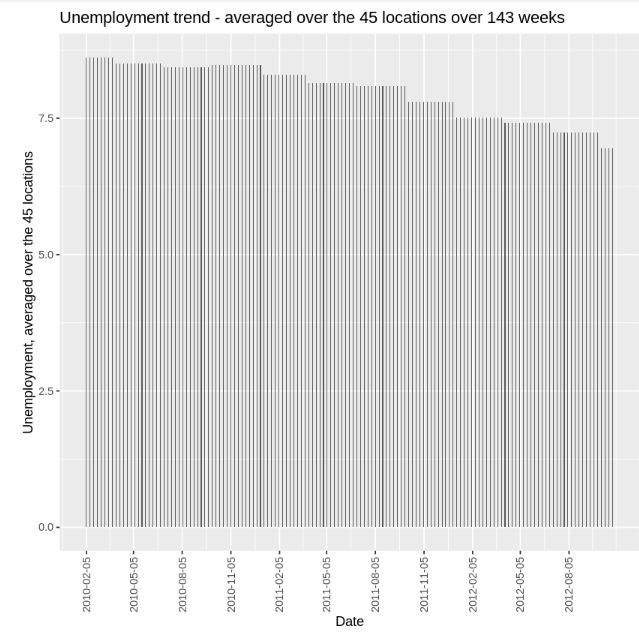
Using the ggplot package again, I was able to perform another piece of interesting exploratory analysis - examining the extent of the recovery in the US economy during this period (2010-2012). As the plot indicates, there’s a steady downward trend in unemployment rates at the 45 locations these Walmart stores are from.
Quantifying and visualizing festive lift
I define my metric of interest as follows : Festive Lift = (Average Sales at each Walmart store during the occasions of Thanksgiving and Christmas - Average sales at each Walmart store outside these occasions) / Average sales at each Walmart store outside these occasions
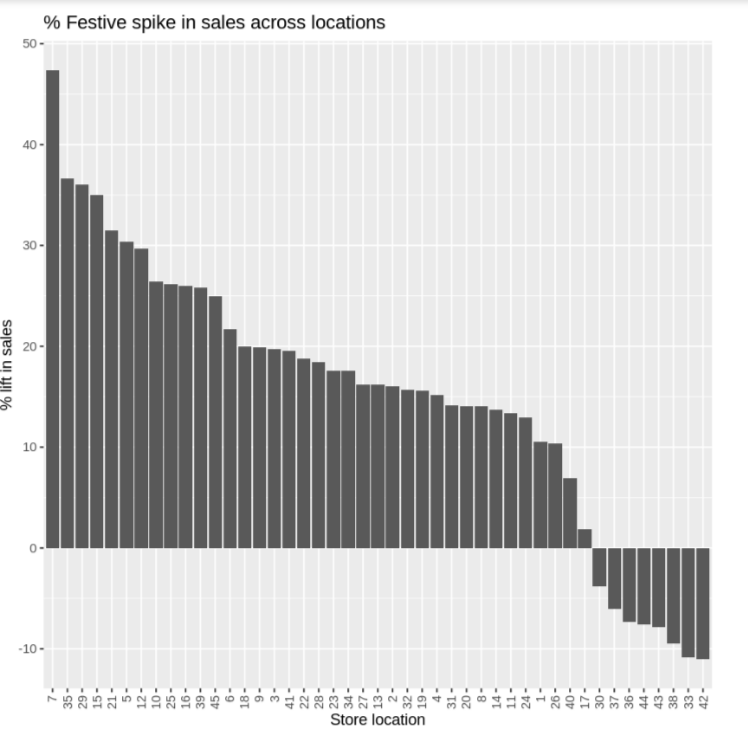
Using R’s dplyr package, and operations like filter, group_by and summarise, I was able to report this metric for each store, which results in this visual :
As is evident here, the vast majority of Walmart stores experience a spike in sales during this time of year. Some stores see well over a 40% surge in business during Thanksgiving and Christmas, as compared to the rest of the year - however, a few outlier stores actually do worse in sales during these times of year!
Managerial implications for marketing decisions
From this analysis, I think that Walmart management has a few things to ponder when making decisions around allocation of marketing resources :
Double down on the stores with the most pronounced festive lift, and execute marketing programs during Thanksgiving and Christmas at these locations.
Conduct deeper research on why certain locations are actually performing worse during this time of year, and identify whether it is due to poor execution of marketing programs, or other effects like forward buying.


